Structural Change
“Inflation is always and everywhere a monetary phenomenon” - Milton Friedman, 1976 Nobel Memorial Prize in Economic Sciences laureate
According to Friedman, persistently high inflation is the result of the supply of money growing at a faster rate than output. Basically, more money is added to the economy than goods and services. Therefore, as demand outstrips supply, prices rise.
Friedman acknowledged the role of supply shocks in provoking episodes of short-term inflation. For example, the present oil crisis from the 2026 Iran War and the trade war with the U.S. are supply shocks. Prior to 2025, the world was grappling with inflation stemming from the COVID-19 pandemic that was supposed to be transitory, then proved to be anything but.
In Chart 1 we show the Consumer Price Index (CPI) of Canada and Manitoba for January of each year from 2014-2026 plus the data for May of 2026.

There are two kinks in the trend line, one in 2021 and another in 2023, which represent a structural change in the time series. Between 2014 and 2021, prices were stable until the pandemic shocked supply chains and sent consumers indoors. The supply chain disruptions were global and led to shortages for all kinds of goods — automobiles were severely affected.
At the same time, households were saving money because their options for leisure and consumption were limited. Once consumers were released back into the wild, spending boomed but supply chain disruptions remained. That disparity, along with strong government spending, helped push prices upward at a pace not seen for decades.
Once it became apparent that inflation was not slowing down, the Bank of Canada increased interest rates to cool the economy and rein in inflation. The interest rate hikes took time to work their way through the economy, only showing up in the data in 2023. In sum, inflation in Canada was below the Bank’s two per cent target before 2021, averaged 5.7 per cent between 2021-2023 (peaking at 8.1 per cent in June of 2022), and finally slowed to 2.4 per cent from 2023-2026 (picking up in 2025).
Along with structural change, we can see that apart from 2023, 2024 and spring 2026 CPI in Canada and Manitoba are nearly identical. In 2023, CPI in Manitoba was higher than Canada largely due to gas prices, passenger vehicle insurance premiums, fresh fruit, and home furnishings and textiles. In 2024, the trend inverted as shelter costs took off in the rest of Canada compared to Manitoba and the newly elected Kinew government introduced the 14 cent-per-litre gas holiday in Manitoba that lasted the entire year. This year, inflation is a bit higher in Manitoba compared to Canada thanks again to gasoline prices and fresh fruit.
Weight a minute
CPI accounts for sales taxes and the quality and quantity of the products, including shrinkflation. The basket has two components: the categories of goods and services in question, and the region where the data was collected (province, territory or metro area). There are 491 elementary aggregate products, or good and services, that are sorted into one of the eight following categories:

- Alcoholic beverages, tobacco and cannabis
- Clothing and footwear
- Food (groceries, takeout and dine-in)
- Health and personal care (dental, physiotherapy, medications, shampoo, etc.)
- Household operations and furnishings (appliances, furniture, cellular services, child care, etc.)
- Recreation, education and reading (computers, tablets, hockey equipment, movie tickets, tuition and books, etc.)
- Shelter (owned or rented)
- Transport (public, private, gasoline, vehicle repair, etc.)
When the basket is constructed, not all products get the same weight in the aggregate measure, nor does every region. The products are weighted by what fraction of total regional consumer expenditure they account for. Likewise, the regions are weighted by what fraction of total national consumer expenditure they account for. After weighting, shampoo has less impact on all-items CPI than gasoline; and smaller regions (P.E.I.) have less impact on national CPI than larger regions (B.C.).
Chart 2 shows the weights for each of the eight categories in Manitoba. The three largest — shelter, transportation, and food — account for 50 per cent of the basket. They also explain the deviations between Manitoba and Canada in 2023, 2024 and this year. Household operations, furnishings and equipment, along with recreation, education and reading, account for 25.2 per cent of the basket. The expenditure shares are jointly determined by the price of the goods; how essential they are to consumers; and how often they are purchased. Clothes are an inexpensive essential item that typically last a long time (except for the fashionistas), while shelter is a very expensive essential item that has to be paid monthly (mortgage or rent).

Chart 3 shows the CPI weights for each Canadian province and their share of Canada’s GDP in 2025. The absolute difference between CPI weights (share of national consumer expenditure) and GDP is less than 1.5 percentage points for all provinces except for Alberta, where the GDP share is three percentage points higher due to the oil industry, an industry where revenues are not all paid out as wages.
Food for thought

Chart 4 shows the top five products, not categories, in Manitoba that had the largest price increase between January 2014 and May 2026. The change in all-items CPI is included for comparison.
Fresh or frozen beef tops the chart with an increase of 132.6 per cent over the past twelve years, while the price of fresh vegetables is now 83.8 per cent higher in that same period. Homeowners’ home insurance and mortgage insurance costs grew at a faster rate (83.1 per cent) than owned accommodations such as houses, condos and other privately owned dwellings (64 per cent).
The price of water utilities purchased by private dwellings (owned or rented) increased by 79.2 per cent, which was slightly more than the cost of video and audio subscription services (Disney+, Netflix, and Spotify). Except for streaming services, the most inflated items in Manitoba are household essentials.
Essential or not, demand for the top five products is highly inelastic (consumers buy the same quantity, or slightly less, when prices significantly increase) because people need to eat, drink and live somewhere. When the price of these products goes up, consumers find a way to cover the extra costs by substituting away from other goods and services, taking on debt, and/or working more hours instead of cutting back on essentials.
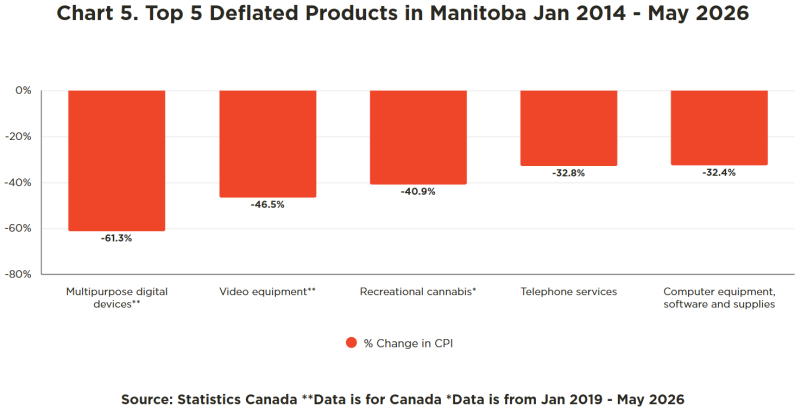
Chart 5 shows the bottom five products that deflated the most in Manitoba between 2014-2026. There are two caveats: the video equipment, multipurpose digital devices (tablets and smartphones), and computer equipment, software and services products are national, not provincial, statistics; and the recreational cannabis data only dates back to 2019, the year after it was first legally sold.
Smartphones and tablets, video equipment, and computers and their parts are global products that are uniform across borders. Canadian and American iPhones, for example, are the same product and can be sold online with ease. With perfect information in the market, prices cannot differ too much across Canada because significant differences will be eroded away through resale (purchasing in cheaper regions and reselling in more expensive regions). The price of these electronic products declined by 61.3 per cent, 46.5 per cent and 32.4 per cent, respectively.
In third place is recreational cannabis which had the largest price decline per year at 5.5 per cent because it has only been available to consumers for seven years while the other items have been available since before 2014. Meanwhile, smartphones and tablets declined by 5.1 per cent per year. The price of telephone (cellular) services has dropped by 32.8 per cent since 2014. Three of these products are considered essentials: smartphones and tablets; telephone services; and computers. As for the remaining non-essentials, video equipment is approaching obsolescence as the cameras of smartphones continue to improve; and recreational marijuana, though enjoyed by some, is not a necessity.
Even for the select few whose CPI basket tilts toward deflated products (sedentary, heavy cannabis-using gamers) it is nearly impossible that the price of their basket deflated since 2014 because they still need the essential items and the prices of these items increased markedly (food expenditure is higher than average for those with the “munchies,” even with the new PST exemption). In addition, the average annual cost of water utilities in Winnipeg for a household ranges from $1,300-$1,500, which is enough to purchase a very nice laptop that would last at least five years.
Monetary or not?

Chart 6 displays the all-items CPI for Canada and the Bank of Canada’s broad measure of the money supply M2 + (gross). Though a simple bivariate comparison, we can see that there is more at work than just the money supply. Since 2014, the latter has increased by more than 100 per cent while inflation increased by 37.8 per cent.
Within the same period, we know the pandemic, trade war, war in Iran and other forces put upward pressure on inflation. Estimating how much M2+ and each of the other factors increased inflation is a challenging task and beyond the scope of this Digest. Instead, we can go through the top/bottom five most inflated/deflated products to get a sense for what is driving the observed trends at a fundamental level.
The classic Supply and Demand model provides a useful framework for understanding how changes in supply and/or demand affect prices, but that model does not explain why these movements occurred. After 2020, prices increased in Manitoba for a myriad of reasons relating to supply and demand:
- COVID-19 supply chain disruptions increased the prices of vehicles and other products.
- Geopolitics, the wars in Iran and Ukraine, decreased the global supply of oil.
- Tariffs from the trade war contributed to inflation in Canada (counter-tariffed goods, vehicles, metals, and lumber products), and especially the U.S which imposed tariffs on more countries than Canada.
- Inadequate competition, Canada’s grocery and greater food supply placed the industry under scrutiny for a lack of competition — which, in theory, leads to higher food prices.
- Government spending in Canada and the U.S. in response to the pandemic and subsequent economic recovery process stoked aggregate demand in both countries and put upward pressure on prices.
- The post-pandemic consumption and population bubble, wherein households increased spending after lockdown restrictions were lifted; and the 2022-24 population bubble increased aggregate demand in the economy, especially for shelter, pushing prices upwards. This source of inflationary pressure has subsided now that Canada’s population is in decline because of the federal government’s new immigration plan.
- Weather, droughts increased the cost of beef and vegetables by decreasing their supply and making future production more expensive. Cattle feed is more expensive due to the poor harvest, and it takes years to increase the size of a herd.
The price declines since 2014 can be attributed to the supply-side of the market:
- Productivity, though not rising at the same pace it used to (Moore’s Law), computing power per dollar is still increasing at a steady rate while other technological advancements are happening at the same time.
- Competition (fair and unfair), the decline in the price of cannabis can be attributed to the initial price being too optimistic, and brutal competition within the industry where firms undercut each other for market share — as well as the ongoing presence of an illicit black market which offers cannabis at a substantial discount.
Inflation analysis is a microcosm of the economics profession. Over the past 12 years, there has been a wide array of factors to account for when analyzing trends in the data — perhaps too many. When the factors do provide a satisfactory explanation of the data, such as tariffs on imports and the war in Iran, that explanation may only be true for a subsample of observations at that one moment of time (neither the tariffs nor the war in Iran can explain inflation before 2025).
Overall, Friedman’s assertion is only partially true, arguably outdated (circa 1963) and borderline tautological. The money supply is not the sole determinant of inflation. Attributing short-term episodes of high inflation to supply shocks ignores demand shocks and does not lend any insight into where either of these shocks, as broadly defined, originated. It is more accurate to say that “inflation is always and everywhere an intrinsically complicated phenomenon.”
Monetary or not, inflation is challenging for Winnipeg businesses and households alike, with gasoline being a great example of how. Gas is a major input into business activity (energy and transport). As it becomes more expensive, businesses have to manage the additional costs which can include price increases, reduced hours and/or altering products.
Households, on the other hand, feel the pinch at the pump, in the grocery store, when travelling (airfare) and in a few other products too. It does not help that 84.1 per cent of Winnipeggers use personal vehicles to commute to work, while only 9.4 per cent use public transit. Nor does it help that Winnipeg is highly dependent upon aviation for travel and trade. Jet fuel prices more than doubled in April of this year and are still more than 30 per cent higher compared to June of 2025. In addition, Manitoba imports most of its fruit and vegetables from abroad —the cost of which will increase with both jet fuel and gasoline prices. That puts more pressure on the price of frozen vegetables in the province (the second most inflated product in Manitoba since 2014).
As for all-items inflation, that can hurt businesses and households in the same way as gasoline and lead to difficult wage negotiations between employers and workers. Both sides need to keep up with price increases but have different ideas for what that means. As it stands, inflation is not presently out of control which means the Bank of Canada does not need to increase interest rates in the short term. However, renewed conflict in the Middle East and/or more trade uncertainty could change the Bank’s position. In the meantime, Winnipeggers can manage more expensive beef and streaming services by opting for different barbecue choices and perhaps some more time outdoors instead of on the couch.
